
Member 360 Analytics for Credit Unions: Designing a Data Model
Credit unions have long been valued for their customer-centric approach and personalized service. They strive to create a seamless member experience by understanding their members' needs and preferences. However, in today's digital age, understanding members' behavior and preferences requires much more than just personal interactions. It calls for collecting and analyzing data to gain insights into members' behavior and preferences.
How to begin, and what are best practices to follow? That's where this Member 360 reference data model comes into play. This model is designed to provide a comprehensive view of members by combining all available data points into one unified view.
This post assumes you already have a data architecture strategy in place or in planning. If not, refer to an earlier article in this series on a reference architecture.
Or see a higher-level overview of reasons to focus on Member 360 data analytics
The goals are to better understand member behavior and preferences, improve the quality of service, and create more personalized offerings.
In this post, we'll take a closer look at how to design a data model in your data warehouse that is suited for member analytics and reporting. Then, I will show some examples of designs for specific subject areas.
Terminology
At Datateer, we follow the Simpler Analytics framework for delivering reporting and analytics. Let’s lay down some definitions so that we are using the same terminology:
- Subject Area. A specific domain or area of interest that represents a particular aspect of an organization. It is a way of organizing data into logical groups based on the business needs and requirements of the organization.
- Audience. An audience is a broad, named group of people who are the intended recipients of a data analytics effort. Credit unions may have internal audiences based on departments or even cross-cutting roles. Members could be identified as an audience, especially when considering member-facing analytics like data visualizations embedded in an online banking experience.
- Segment. A segment for Member 360 purposes is the result of the act of segmenting members into narrow categories based on their needs and preferences. Segments are used in marketing efforts and sometimes member experience designs.
- Fact table. A fact table contains measures and. Any metric or KPI you might want to analyze will have its measurements stored in a fact table.
- Dimension table. A dimension allows grouping, filtering, and sorting the measurements contained in fact tables. Terms like drill in, rollup, and aggregate are all facilitated by dimensional analysis. Dimensions describe facts, and common dimensions include time/date, location, and product.
Design principles
Kimball methodology
Our experience at Datateer has shown following the Kimball design methodology to be superior to other approaches for data analytics. Star schemas, with fact and associated dimensions, have benefits over other methods we have evaluated and implemented.
Although not new–and not without detractors–this design method has crossed the chasm and proven itself in modern data analytics. It is acceptably fast even with large data volumes and is the easiest to understand for analysts, data scientists, and business users.
To follow this methodology, design fact tables that reference dimension tables.
Conformed dimensions
Dimension tables should be reused across fact tables. Using the member dimension as an example–any dimensional analysis on the member dimension should refer to the same “dim_members” table.
In organizations large and small, consistency of terminology and in definitions of key entities is critical. If multiple departments have slightly different definitions of what “member” technically means, this principle of conformed dimensions will force that conversation to the surface.
Successful data analytics efforts force the issue and come to a consensus of what “member” means in the organization. Organizations that allow multiple definitions of “member” in centralized analytics are less successful.
No many-to-many tables
Many-to-many relationships provide proper normalization in a transactional application database, but have no place in an analytical data model. They overcomplicate the model, making it difficult to understand and maintain. Also, they negatively impact performance by requiring more joins than necessary
Subject areas
Breaking down an analytical data model into subject areas aligned with business objectives brings focus and better understanding.
- Products & Services. Which products and services members use, and how they use them. These include deposit accounts, loans, credit cards, mortgages, insurance, and investment services.
- Marketing & campaigns. Tracking success of marketing campaigns related to the target member segments, associated costs, and cross-selling effectiveness
- Transaction history. All transactions made by members in their accounts, including withdrawals, deposits, and transfers.
- Credit history. Members’ credit history, credit score, and credit utilization
- Interaction history and preferences. Tracking members’ contact history, including service tickets, inquiries, complaints, and appointments.
- Profile. Members’ basic information like name, address, and phone number, as well as demographic data like age, gender, occupation, and income.
- Risk & compliance. Tracking know-your-customer data, fraud detection, and regulatory reporting requirements.
Each subject area tracks measurements specific to the analyses that it needs to support. These are independent fact tables.
Many dimensions, however, can be shared across subject areas. The best example of this is the member dimension, which relates to all these subject areas in a Member 360 effort.
Design Examples
These examples are based on Datateer’s experience in customer/member 360 analytics, and from data models that power Datateer’s Instant Analytics. Even though your situation is unique, my goal is to provide a solid starting point you can use to apply to your own analytical data models.
Each of these examples incorporates the member dimension, allowing analysis by member segment.
Credit scores
Credit scores are an important input to underwriting and risk analyses. In the example below, we track credit scores in a fact table named fct_credit_scores. The dimensions we apply are date, member, location, and credit agency.
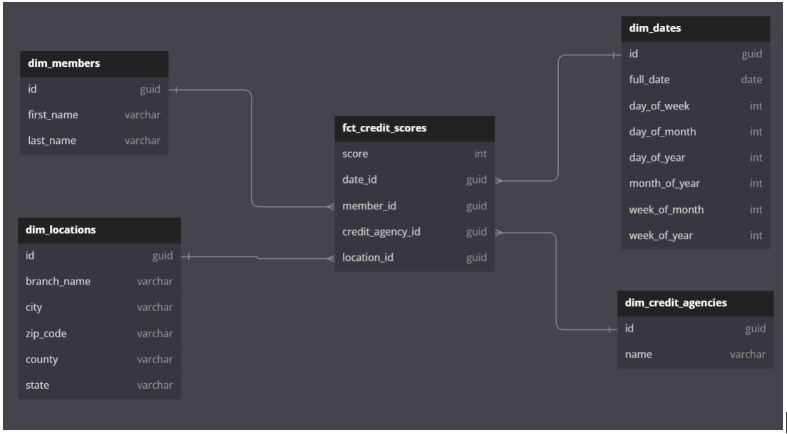
This allows answers to different types of analysis questions around credit scores and history:
- What is a segment of customers whose credit scores have declined more than 25% in the past quarter?
- Does one credit agency consistently report higher credit scores than the others?
- What is the distribution of the number of members by credit scores?
- Which branches have members with the highest average credit scores?
Transactions
Recording transaction history allows analyzing member behavior by specific segment. Depending on the granularity of the questions that are part of the analysis, this fact table can be a daily summary, or it can track individual transactions.
The fact table in the middle measures transaction amounts and daily balances. The dimensions date, member, and account allow trending analysis by member, account, and segment.
I added a reference from the account dimension table to the member table, for convenience in filtering. A slightly more advanced–and more pure–pattern would be to have a member-account dimension that combines member and account
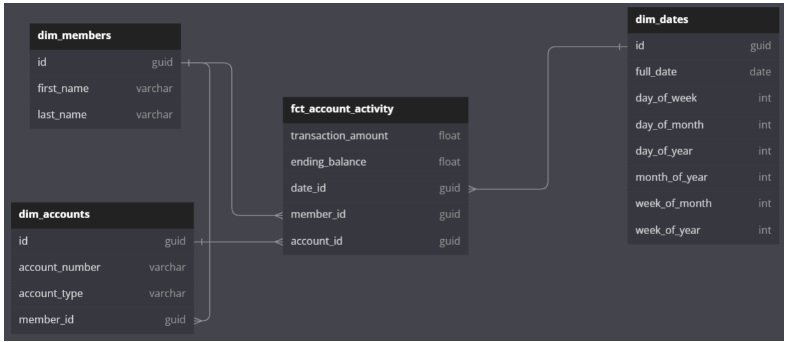
Questions that this star schema can answer include:
- Are account balances trending down or up? By how much?
- Are certain segments of customers pulling out their deposits?
- For checking accounts in segment X, what was the net deposit and withdrawal activity last month?
Net Promoter Score (NPS)
Net Promoter Score is a common way to measure overall member satisfaction. With two dimensions–member and date–surrounding a fact table in the middle to measure scores, you get a star schema like this:
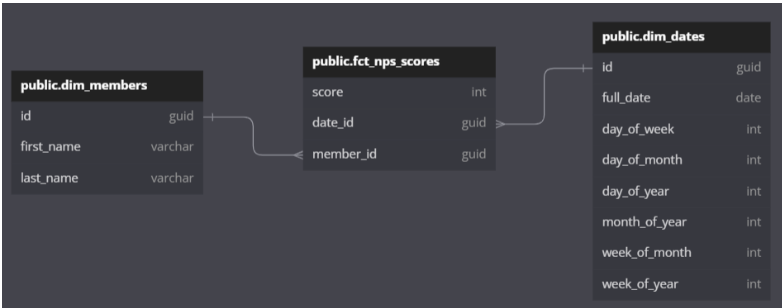
Even a simple star schema like this allows you to answer a variety of questions. Here are some examples:
- What is my average NPS score?
- How many of my members submitted an NPS score this month?
- How many of my members are detractors, indifferents, or promoters?
One member, many segments
The examples above illustrate good analyses, but they are a bit naïve. Members can belong to multiple segments! A simple but effective way to model this is to add columns to represent segments the member belongs to.
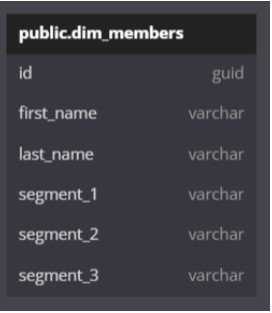
Although seemingly simple, this approach provides the same dimensional analysis capabilities as more advanced approaches, including grouping, sorting, and filtering. This approach is manageable up to about 10 segments, and is a good place to start.
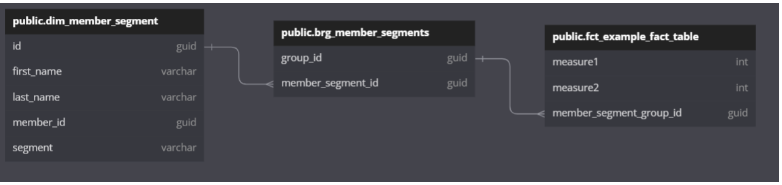
For a more advanced pattern, you can either use a bridge table to a separate member-segment dimension, a bridge from the member dimension, or a many-to-many join table to a segment dimension. Here is an example of a bridge table to a member-segment dimension table.
Member History
In the real world, a member’s attributes can change. By tracking a dimension’s history, the data model will continue to support historical or “lookback” analysis.
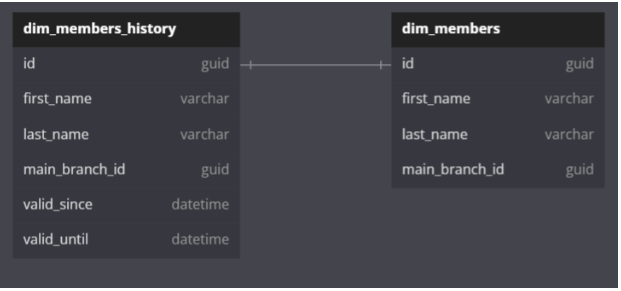
For example, the diagram below tracks the history of a member’s main branch. The dimension becomes a view or table that only contains the most recent data from the member history table.
Any analyses that need historical data about the member’s prior branch can use the member history table to access that historical data.
Designing a flexible data model is an iterative approach allowing you to have KPIs and metrics specific to your credit union's unique needs.