
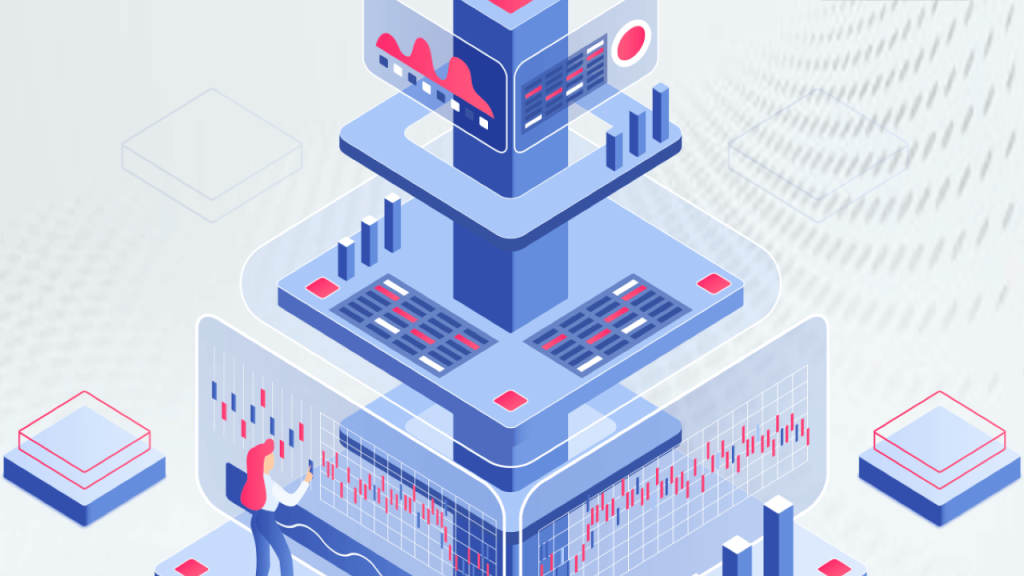
In-Depth Look Into The Modern Data Stack
A good analytics function in a business requires a combination of deep domain expertise, technical acumen, and data experience. Unfortunately, most of us lack at least one of those.
This article is for leaders responsible for analytics in your organization, especially if you lack deep experience in technology or data. Inevitably you will have to make product and technology decisions. I want you to have a good mental model for modern analytics and a solid vocabulary to participate in conversations with vendors, consultants, data teams, and executives.
The most prevalent and modern method of building an analytics platform nowadays is known as the “Modern Data Stack.”
Data Analytics platform: a data solution that provides tools and technology from the beginning to the end of the life of the data. It includes data retrieval, storage, analytics, management, and visualization.
Modern Data Stack (MDS) Definition
The Modern Data Stack (MDS) refers to the cloud-based tools and software used to gather, organize, store, and transform data into workable business intelligence and dashboards.
At a high level, the Modern Data Stack should contain the following elements:
- Best of breed (vs. a single product that does it all)
- Scalable
- Cloud-native
- Centered on a data warehouse
- Follows an ELT pattern
Cloud-native: a flexible way to store and structure data in a scalable way (allows for growth) and can be accessed quickly from anywhere. More than just an architecture for data, it’s an entire fully automated ecosystem for interacting with data.

How to Visualize the Modern Data Stack
I like to visualize the Modern Data Stack as data moving in a left-to-right flow. The phrase “data pipeline” is often used, conjuring up images of oil pipelines and refineries. It’s a good analogy of the refinement process that data goes through as it progresses through these components.
I’ll go into details on each of these components in a moment. For now, here is the overview:
Data Sources
On the far left are your data sources–anything that produces data that you need to analyze.
Data Lake
Next, we have the data lake, which is a landing zone for collecting raw data from the data sources.
Data Warehouse
From the lake, data is transformed in the data warehouse.
Various processes (orchestration, observability, quality, support) plug into the warehouse in a general concept known collectively as DataOps (short for data operations).
Business Intelligence & Analytics
Once the data in the warehouse is transformed into an analytical data model, it is consumed by various audiences through data products appropriate for their needs. The most common data products companies start with are data dashboards or direct connections from spreadsheets.

Deep-Dive Into The Components of the Modern Data Stack
Let’s go into more detail about these components. Something to keep in mind as you read through these–you don’t have to build these yourself. In fact, that is a poor practice with low ROI. For example, an intuitive approach is to build your own data connectors–”how hard could it be?”
The best ROI is through combining specialized products and tools into a cohesive analytics platform.
Data Sources
Data sources refer to anything that houses data you want to include in your analyses or metrics. They include things like:
- SaaS applications like a CRM
- ERP systems
- In-house databases created by IT
- Public data sources like census or weather data
- Data brokers or providers who sell data
- Spreadsheets that are manually maintained but critical to your operations
Connectors
Connectors are software tools that know how to do two things: extract data from sources and load data into destinations (typically the data lake or data warehouse).
This is a deceivingly complicated situation. First off, each connector is unique because each data source is unique. Imagine trying to create and maintain data connectors for all the thousands of SaaS products that are out there.
Next, imagine trying to ensure you can support all the possible destinations.
It could be a nightmare. It is the single biggest challenge for vendors that specialize in data connectors.
Data Lake
The data lake concept has been maligned and in some circles, fallen out of favor completely. But I don’t see it as optional. It serves three main purposes:
The Data Lake Acts As A Landing Zone
A data lake serves as a landing zone for collecting data from sources. Modern warehouses can perform this function–usually.
If the connector you are using is robust at loading data directly into the warehouse, go for it! However, pushing data into a data lake is simpler, so fewer things can go wrong. The data lake also gives you a place to perform basic cleansing and preparation on the raw data.
Data Lake Gives Direct Access To Raw Data
More importantly but not as immediately obvious, the lake can be a place where data scientists can get direct access to raw data, where the original copy is guaranteed to be untouched and unmodified.
Just having data from multiple sources in one place is a big benefit for data scientists or analysts who otherwise would have to do that raw collection themselves.
Separating The Lake From The Warehouse Reduces Vendor Lock-In
As you get into your analytics platform, you will quickly realize that the warehouse is the center of gravity and the biggest cost. The market will soon be dominated by a few large players who will continue to attempt to monetize you even more. Separating the lake functions from the warehouse will reduce vendor lock-in.
Data Warehouse
The data warehouse is the center of the universe in the Modern Data Stack. At its core, it is just a database.
- They support the SQL language, which is the ubiquitous way of querying data in databases.
- Tools that can connect to other databases usually can also connect to data warehouses.
- Data is presented and interacted with in the well-established paradigms of tables, columns, and views.
An important distinction is that warehouses targeting the Modern Data Stack are cloud-native. They are designed for scale and priced on consumption. They can grow and grow to an unlimited scale (okay yes at some point there is a limit. But you aren’t Amazon or Walmart, right?).
Data Warehouses Are The Biggest Cost In Your Modern Data Stack
I’ll bring up cost here because warehouses are almost always the main cost driver of your entire analytics platform. If you are familiar with SaaS products that typically have a monthly subscription, consumption pricing is next level. You are charged by the computing resources your operations consume, metered by the hour or sometimes down to the sub-second.
The best analogy is your electricity bill. The more lights you turn on and devices you plug in, the more electricity you use, and the higher your bill will be.
So although you are in control, there is no ceiling, and you are responsible for monitoring costs more closely than you may be accustomed to doing.
Related Article: How Much Do Data Analytics Services Cost?
Orchestration
Orchestration refers to getting all these tools and products to play nicely together. The analogy is a literal music orchestra, with a conductor at the front keeping time and directing the flow.
Good tools and products exist for orchestration, but I have found this is an area where my teams spend significant engineering work.
Orchestration products provide the logic flow of what should happen and when, schedules or triggers to run programs that process data in the pipelines, and capture errors for triage and troubleshooting.
Data Products
Ultimately your audiences–whether they be employees, customers, or some other group–do not care about the technical underpinnings. They want access to the data. Data products are any asset you manage that allows your audiences to see and use the data. Typical examples include:
- Dashboards
- Visualizations
- Reports
- Notebooks
- Data Apps
- Datasets you expose directly to consumers (e.g. a view in a database could be a data product if you let people use it directly, but not all views in the database are data products)
As you go on your analytics journey, data products will proliferate. It’s natural. But only 20-50% of the data products you produce and manage will be valuable. That’s also just inevitable. Too many organizations treat them like permanent fixtures when they should be purging or redesigning.
It is also inevitable that in a living system, these data products must be maintained, or they will gradually decline in value. The thing to remember here is to treat them like assets and actively manage them.
Related Article: A Guide to Picking the Right Embedded Analytics Platform
Advanced Modern Data Stack Components
Any journey in analytics is a crawl-walk-run journey. Be wary of anyone who tries to sell you otherwise. Implementing the core components from above will get you huge value, even if some of the benefits of the advanced components are not in place.
Artificial Intelligence or Machine Learning
Often abbreviated AI/ML, this simply means applying statistical methods and models to the data in your warehouse. For example, a popular application is applying linear algebra to historical data to predict future trends.
Most leaders recognize the power that predictive analytics can have on their business. So, if there is a shortage in data talent in general, there is an extreme shortage in data scientists–people who have deep experience in a combination of your specific business domain, programming, working with data, and statistics.
What is exciting is the number of vendors pursuing “low code” or “no code” solutions for AI/ML. While they will never surpass the capabilities of a true data scientist, they certainly deliver a lot of value for a much lower price tag.
Governance
Governance answers the all-important question in business data, "Who can see what?" In other words:
- what level of access does each user role have
- what are you using for version control to keep track of modifications and access
- what security certifications are required for your business data to keep your (and your clients') data safe
Data Observability and Data Quality
I lump these together because most products that focus here do a mix of both. Data quality is the goal, with observability being a mechanism to get there.
Data quality is simply that the data can be trusted, is timely, is accurate, complete, etc. There are no industry standards for this. But it is a nice concept to use when audiences begin to mistrust data for a variety of reasons. Framing those conversations as data quality conversations can align everyone’s thinking.
Data observability is the concept of being able to see into the data pipelines and understand what is going on. This is especially helpful when there are errors or problems, but it is also useful for things like automatically detecting statistical differences in data.
For example, if revenue spikes 100% overnight, that most likely is a data quality problem with a root cause that can be found through data observability tooling.
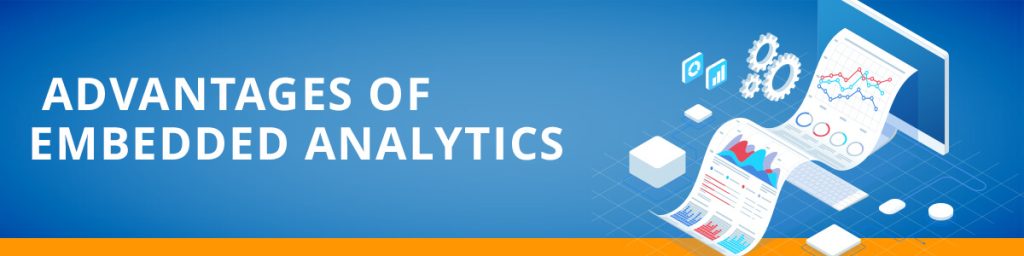
Embedded Analytics
One of the most valuable things a company can do with data is create insights for their customers as the audience. A popular method to do this is embedded analytics, which means creating a visualization or dashboard in a specialized tool, and then exposing that visualization or dashboard into a SaaS application so that end users can see it.
This is not overly complicated but does require collaboration between product management, application engineering, and data teams.
Related Article: What is Embedded Analytics?
Reverse ETL or Operational Analytics
These are fancy-sounding terms that mean something quite simple. Once data is collected transformed, and made valuable in a warehouse, why not push it back out to the operational systems?
In this component, the data sources can become data destinations. Imagine gathering data about customers and orders from CRM, billing systems, customer support tickets, etc and creating a nice 360-degree picture of each customer. Wouldn’t it be nice to push that information back into the CRM, where the sales team lives and breathes?
Streaming
Most analytics platforms at mid-sized companies are batch oriented. Daily data updates are the most prevalent pattern, but even updates every 10 minutes are considered batch updates–they are just smaller batches.
Batch: a system relied on for processing and analyzing vast quantities of data simultaneously. Applies to companies that hold their data in store for a period of time, as opposed to streaming data.
Streaming is a different animal and is required for true real-time or near-real-time operations. In general, the tooling for streaming is quite mature–but not for analytics platforms. Robust streaming tooling has been available to applications and operations like Internet of Things for a while and, in the coming years, analytics tooling will catch up.

Additional Important MDS Concepts
Here are a few operational concepts and design patterns that you should be aware of even in an executive or completely non-technical role. You almost certainly will be asked to weigh in with your opinion to give guidance to the technical folks.
ELT vs. ETL
ETL stands for “extract, transform, load” and is a pattern that has been in place for decades. It is a data pipeline pattern that means extracting data from sources, transforming data, and loading data into a destination like a warehouse.
The problem with this pattern is it lumps the business logic of the data transformations together with the technical plumbing of moving data around. This may seem trivial, but it isn’t.
By switching the order of operations–ELT or “extract, load, transform”--we can separate the plumbing of extract and load from the business logic of transform.
This leads to a much, much more flexible system and you should have a strong opinion here!
Combining Data Across Sources
If all you need to do is analyze data from a single data source, the Modern Data Stack is not the right solution for your business.
The true power comes from bringing data together from multiple sources and doing analyses only made possible by being able to look across an entire business.
I point this out because a common mistake is to expose raw data as a Data Product. If people get comfortable with the raw data, they will push back when you try to move them to use combined, transformed data.
Worse, if your CRM tracks a real-world human by calling them a “contact,” but your billing system calls a human a “person,” then we have a terminology problem when it comes to analytics. Data efforts are already complicated enough, and terminology can be death by a thousand cuts.
Analytical Data Modeling
An analytical data model is an opinionated view of your business, made up of transformed data from multiple sources and designed for analysis at a large scale. I’ll break that down:
An opinionated view means you’ve reconciled terminology discrepancies and found (or forced) alignment on metrics and their definitions.
Data from multiple sources is not only brought together but converted into this opinionated view and combined. I.e. the “contact” and “person” records from above don’t live in different places in the warehouse but are merged together.
Designed for analysis means the structure of the tables and columns is designed to handle queries on large data sets, such as a metric that calculates average order size across your entire order history for the entire company.

Scaling
Scaling means growing or shrinking your system to support the workload at hand. Any cloud-based product vendor will tell you scaling is a solved problem. It isn’t, but the mechanics of scaling are way better than in the past.
If you are familiar with cloud platforms, you will be familiar with scaling. If not, here is a primer: before cloud, you had to run your systems on physical servers that you purchased. Buy a server that is too small, and your system (e.g., such as your website) might crash from too many users and too much load. So if you decide to buy a huge server guaranteed to support your users–you have overspent on capacity that you may never need.
In the cloud, scaling is configurable. Sometimes you can manually decide how powerful to make a component; sometimes, it is automatic. In all cases, you pay for it, so tuning is required.
You will be responsible for an analytics platform that is made up of many components, each with its own scaling approaches and limitations. Inevitably you will need an opinion on the tradeoffs between cost and high scale.
Emergent Systems and Iterative Implementation
Let me cut to the chase–you will not get all this right the first time. Historically, business intelligence or analytics efforts were huge projects that did not release anything out to the intended audiences for 12-18 months or longer.
We do not live in that world because the Modern Data Stack and its associated tooling, embrace fast change and iterative development. The result is business value earlier and ultimately more business value because the system is aligned with the needs and opportunities.
However, the gravity of doing a big project is still very real. It manifests itself in many ways, such as phrases like “Go ahead and connect to data source X, we might need it” to “We can’t start building dashboards until the data model is done.”
Advice For Business Leaders Regarding the Modern Data Stack
Vet Each Modern Data Stack Tool Independently (Regardless of Partnerships)
If you are just starting to explore how to put together a good analytics platform for your business, it is extremely easy to get caught up in all of the products.
What tends to happen is as you start to select products or tools, those companies have a network of partners and will direct you to use their partner companies. It’s not necessarily a bad thing, but ask the question of why they partner with certain companies and why they passed on others.
Things that are important to you will stick out, and it will help you build out a list of possible alternative products without getting sucked into the hype.
There Are Varying Levels Of Integration & Pluggability Between Vendors
Because the Modern Data Stack is a pseudo-standard in the industry, implementers and product vendors all understand this general blueprint. What they create generally fits with the standard blueprint, making things pluggable.
But because this is not a true industry standard, levels of integration and pluggability vary. Sometimes painfully so.
If you have been an owner or user of data warehouses in the past, be ready: operations are generally looser, the pace of change is (or can be) much faster, and containing cloud costs is super important.
When Hiring Talent Look For Someone With A Deep Understanding Of The Modern Data Stack
When hiring data people, one thing I look for is understanding and passion about the Modern Data Stack. I remember when the light bulb went off for me. It was the first time I saw software engineering best practices applied to data – a novel concept even today. It was eye-opening, and the possibilities were exhilarating.
From there, it was a journey through dozens of Slack communities (each with thousands of members), reading opinion articles on how the Modern Data Stack should work, new conferences dedicated to pieces of the Modern Data Stack, and trying to keep up with the hundreds of companies receiving VC investment and promising to be the silver bullet to all the shortcomings of all data everywhere.
Point being, there are a lot of newbies and a lot of excitement. But this is still a relatively new concept, so there is a lot of inexperience and mistakes. There is also a shortage of reliable talent with sufficient experience, and it’s getting worse. EY notes an increase of 50% in 2022 of executives focusing on data initiatives and increasing hiring.
Maybe the shortage will resolve itself as the tens of thousands of junior folks upskill and gain experience. But for the foreseeable future, demand is outpacing supply.
Conclusion
Is the Modern Data Stack the only way to go? Certainly not, but it by far has the most traction compared to other approaches. The speed of development, shortened time to value, best-of-breed selection, flexibility, scalability, and usability of the Modern Data Stack results in a winning combination.
If you want a partner to help you navigate and manage your analytics journey, from crawl all the way to run, let’s talk about Datateer’s Managed Analytics Platform. Or if you want to learn more about this type of service, check out our Guide to Managed Analytics.
In future articles, I’ll discuss antipatterns to avoid, the Analytics Operating System to help you put the right processes on top of the Modern Data Stack architecture, and dig into benefits and drawbacks.