One of the greatest ways to monetize your company's data is by sharing insights and information with your customers. Every company is sitting on data that customers and other external parties would find very valuable.
Embedding data visualizations and dashboards directly into your website or application gives your audiences real-time, self-service access to your data. This creates a more valuable product experience that leads to more satisfied customers who stick around longer.
What does embedded analytics mean?
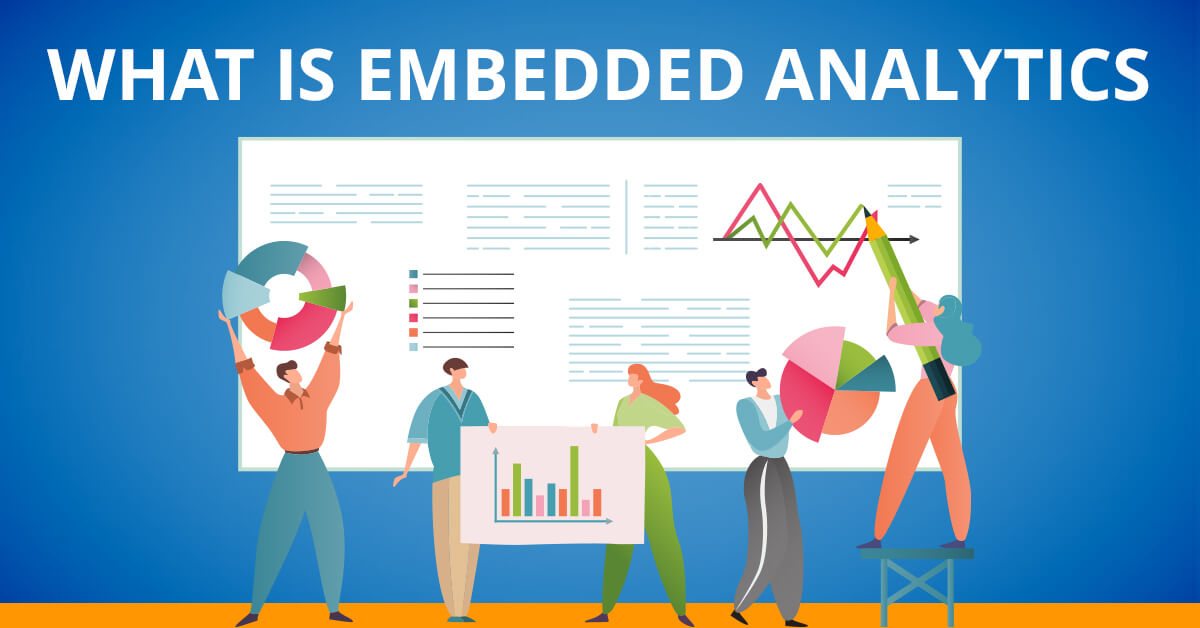
Embedded analytics means surfacing data visualizations, dashboards, or reports into other applications. This can be done internally--for example, showing a chart from your business intelligence tool within your CRM. Or, analytics can be "embedded" within your existing web site or application.
By bringing insights and information to where your audiences are already doing their work, they get everything in context without having to log into a separate application.
Building live dashboards and data visualizations is most easily done in specialized tools. These tools provide the capability for embedding dashboards and visualizations into other applications–such as your product. This is important because your customers are already using your product. By putting these dashboards and visualizations directly into your product, your users can see everything self-service and real-time.
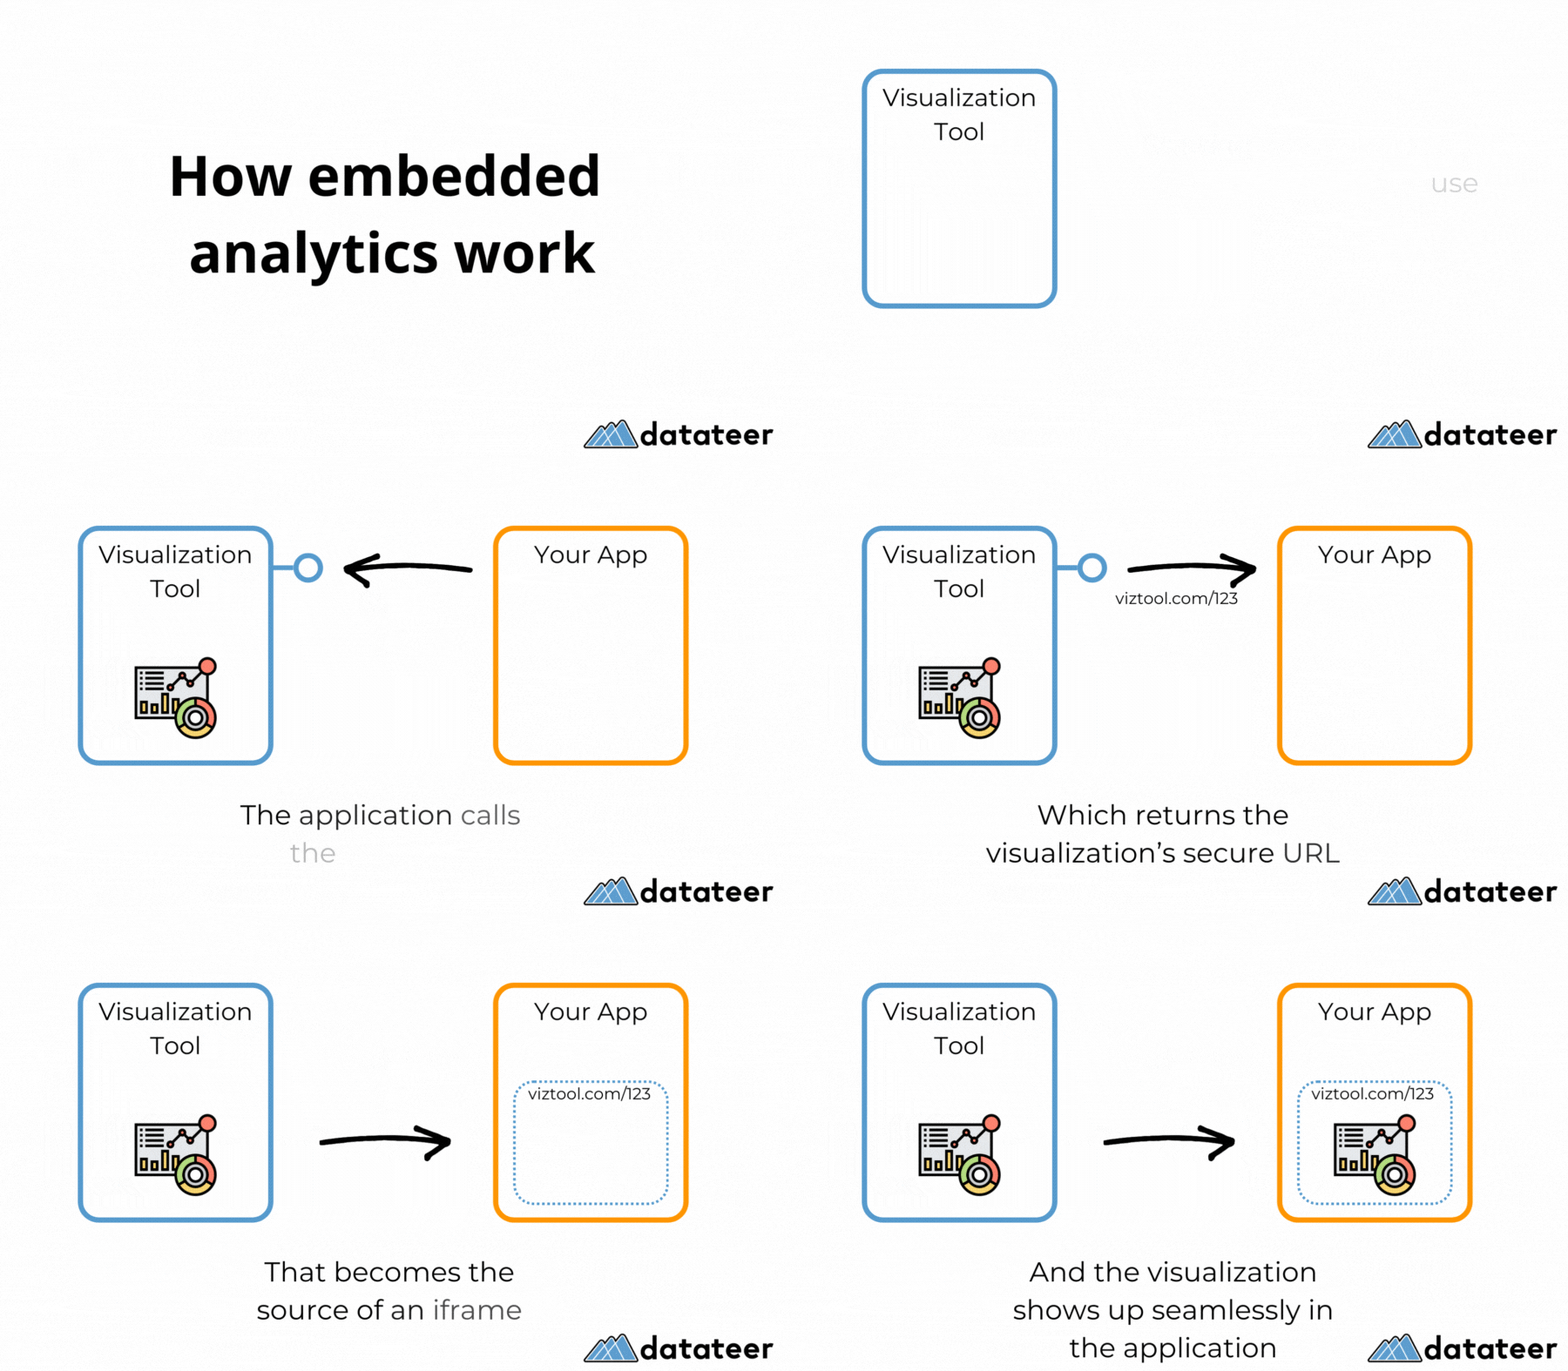
Embedding is accomplished by the capabilities of the business intelligence tool or product that you are using. Typically this is done by using iframes and secure links.
What is an embedded analytics platform?
An embedded analytics platform has capabilities of visualizing data and sharing that data through the practice of embedding.
Most often, embedding is a feature of a data visualization or business intelligence product. You configure this product to securely connect to your data warehouse, create the visualizations of that data, apply styling and design to match your corporate brand, and configure where and how the visualizations can be embedded.
What are Data Products?
A data product describes something that delivers data analytics or insights to an end user.
For example, a dashboard that answers specific questions is a data product.
Data is a big world, and the phrase “data product” helps distinguish something intended to be customer-facing from all other technologies or data usages that might be behind the scenes. A suite of data products can be formed into a data analytics platform.
In the past, reports and dashboards were viewed as internal artifacts. It was no big deal if they didn't meet branding or customer experience standards. Robustness was important but not critical--if they went down for a day, everything was okay.
For customer-facing data products, the robustness and correctness of the data is crucial to build and maintain trust with your customers. Each customer-facing data visualization must be accurate and up, all the time.

Why Use Embedded Analytics?
Embedded analytics brings data-driven insights directly into your customers’ daily workflows, applications, and portals. By seamlessly integrating analytics into your products, you empower users to make informed decisions and enhance your product.
This not only elevates the user experience but also opens up new avenues for customer and partner engagement while reducing the operational effort involved in data reporting.
Improves the Customer Experience
Just as you want insights and visibility into your own business, your customers want visibility and insights from the services you provide to them. Providing analytics to your customers differentiates your product, which makes a big difference in a competitive market.
Customer-facing insights can change your interactions from transactional to strategic, as you can answer questions beyond the initial transaction.
Embedded analytics can easily show usage and ROI to your buyers, proving the value of your service and giving your customers comfort and confirmation of their purchase.
Expands Customer & Partner Offerings
By incorporating embedded analytics into your data products, you can significantly enrich what you offer to customers and partners. You could create specialized data-driven embedded analytics features that serve their specific needs. This adds value to your product, making it more appealing and functional. Your business partners also benefit from the enriched data insights, which can inform their decision-making processes.
Embedded analytics can elevate your product and broaden your market reach, satisfying both your customers and business partnerships.
Improves Business Relationships with Analytics Transparency
Integrating transparent analytics into your product doesn't just offer data; it offers a competitive edge that sets you apart from rivals.
Transparency fosters trust and turns what might have been a one-time transaction into an ongoing strategic relationship. Your customers will come to rely on the unique insights they can only get from your embedded analytics platforms. This makes your product more "sticky" — meaning it becomes so embedded in your customers' daily processes that the thought of switching to a competitor becomes daunting.
By making your platform indispensable for informed decision-making, you cement longer-term relationships, increasing customer loyalty and retention.
How do you use embedded analytics?
Many business intelligence products and data visualization tools make visualizing data easy to do. The problem with this is these data visualizations are disconnected from your end customers. Many of these tools provide a capability to securely expose data visualizations and dashboards to your end users within your own application.
This can be seamless and is typically accomplished by secure URLs and iframes. It is a technical exercise that keeps things secure and seamless for your end users.
What are the limitations of embedded analytics?
Mobile and responsive design can be a limitation of embedded analytics. This inherently depends on the capabilities of the business intelligence product or data visualization tool you are using for the embedded analytics.
Perfect matching of aesthetics like colors, fonts, and style is not always guaranteed. This also depends on the capabilities of the tool you use to develop the data visualizations.
Adding another tool to your application stack creates an additional component to ensure is up and running.
Because of these limitations, some of our clients decide to bypass embedding altogether and instead write their own visualizations from scratch. Although technically possible, we have seen this to be a 10x-20x increase in effort and complexity compared to the simplicity of embedding.

Exploring Features of Embedded Analytics Platforms
Embedded Analytics Dashboards
Dashboards are reporting overviews that carry a lot of information at once. They are interactive for people who use them. Because of their visual nature, they are rich and pack a lot of insights into a glance. Embedded analytics platforms often have the capability of building full dashboards that can then be shared and embedded elsewhere.
Embedded Data Visualization
When a dashboard is not the preferred user experience, sometimes a single data visualization is more appropriate. This is often the case when the product owner wants to bring specific insights directly into the existing user experience, rather than have their users go to a separate page to view a dashboard.
Embedded Reporting Tools
Embedding analytics into your product means you can automatically generate and share embedded reports with your customers. Gone are the days of manually creating each report, saving you a lot of time and effort.
Embedded reports can be tailored to show the exact data your customers care about, making it easier for them to understand their own data management products. With this feature, your customers have real-time access to their data whenever they need it.
By reducing the manual work involved in reporting, you free up time to focus on improving your embedded analytics software and growing your business.
Embedded Analytics Security
Embedding is typically implemented using HTML iframes. Security concerns around iframes are based on a long history in the web. Specific malicious uses of iframes–not well understood by people who are not security experts–have led to a general unease about using iframes.
For example, clickjacking is a common concern but is only possible when the website owner has malicious intent.
With regard to embedded analytics, most (maybe all) business intelligence product vendors follow data security and compliance best practices:
Use only trusted sources (your business intelligence vendor is a trusted source)
Use HTTPS
Use the sandbox attribute for origin restrictions
Use the sandbox attribute for content restrictions
Most importantly, neither side of the iframe embed has malicious intent. Your website and the business intelligence vendor’s embedded dashboard do what they say they are going to do and are not attempting any form of cross-site scripting, phishing, or clickjacking.
White-Label Embedded Analytics Options
With white-label analytics, your embedded analytics can seamlessly match the look and feel of your own product. This creates a smooth, integrated experience for your customers, making it appear as if the analytics were developed in-house.
The real win comes with automation. Your customers can pull up data analytics products whenever they want, without having to wait for manual updates. This self-service feature boosts customer satisfaction, as they can access vital information on-demand, directly within your embedded analytics tool.
You are not just providing analytics; you are offering a fully integrated, self-service experience that complements your embedded analytics software perfectly.

How to Choose the Best Embedded Analytics Platform
Below are some considerations to keep in mind when deciding on which embedded analytics platform will be the right one for your company.
Understanding Your Business Needs and Goals
Embedded analytics is one of the most straightforward ways to monetize your data, differentiate your product, and provide more value to your customers. For B2B companies, sharing insights and data with your customers indicates transparency and helps customers prove the ROI of using the B2B services.
Like any effort involving data analytics, there is technology and complexity involved. By being clear what you want to share with your external audiences and how you expect it to impact your business, you will be guiding the implementation and setting yourself up as success.
Evaluating Scalability and Flexibility
Some data visualization products and platforms are large and attempt to do more than is necessary. Other products are more narrow in their focus, which requires more specialized products to get to a solution. However, this is more than a best-in-class vs best-in-breed decision. Because of the complexity inherent in data analytics, the best practice is to limit the number of tools and choose products that are specific to your needs.
A cloud data warehouse with a fit-for-purpose BI tool bring the most flexibility and scalability.
Considering Cost-effectiveness and ROI
Product vendors understand the potential value of data, and charge accordingly. There is a premium in the market for customer-facing, embedded analytics.
Vendors are happy to do demos and talk through the merits of their products. Generally in the data analytics market these are professionals and it is a pleasant experience.
One way to kick-start your evaluation is by narrowing the field of contenders with the BI tool Product Evaluation Matrix, by Datateer.
Consider Ease of Use
Ensure you look for an embedded analytics platform that makes it easy to embed in your product or customer portal. You want to make sure that the embedded analytics platform ensures your data quality is high enough to expose to your customers. Once embedded, these analytics blend seamlessly into the existing user experience, looking and feeling like a native part of your platform.
This ease and seamless integration enable you to extend the reach of your data insights across all touchpoints, enhancing decision-making and boosting user engagement with your embedded dashboards.
Conclusion
Choosing to pursue embedded analytics continues to be a differentiator in the market. Businesses that provide good insights to their customers enjoy a more strategic relationship, more revenue opportunities, higher customer-lifetime value, and lower churn.
Any business--and especially B2B companies--can benefit from unlocking the value of their data and pursuing a strategy that includes embedded analytics solutions.
What Clients Say About Datateer Embedded Analytics Services
"We created 100 different metrics very relevant to our customers. We have seen significant growth in our key accounts."

Paul Harty
Chief Strategy Officer @ Motion Recruitment
"Datateer understood our data and consolidated all that information in a way that dramatically improved the speed and quality of client conversations."

Devin Mulhern
Managing Director @ Denver South Economic Development Partnership
